pele GUI
pele is primarily designed to be used as a library, but there is an extensive GUI as well. The gui can be used to explore almost everything implemented in pele. An example workflow might be:
- Run basinhopping to find the global minimum structure.
- See a list of minima found and view the structure in 3D using openGL.
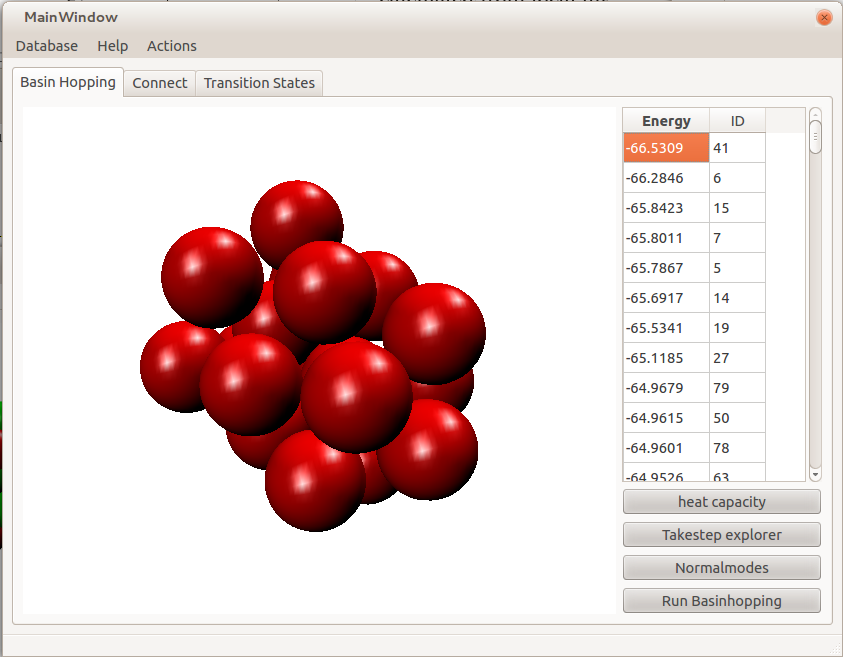
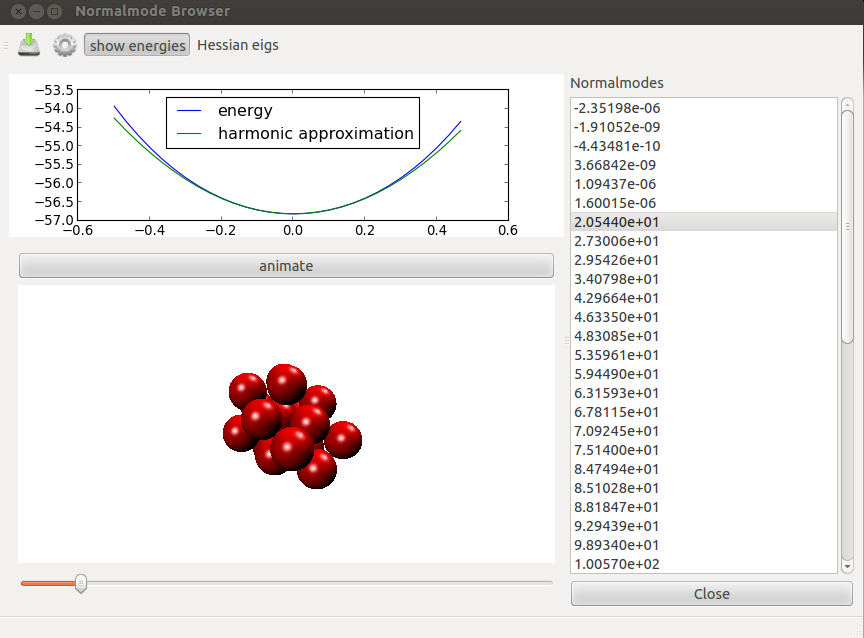
- View the normal modes of each structure.
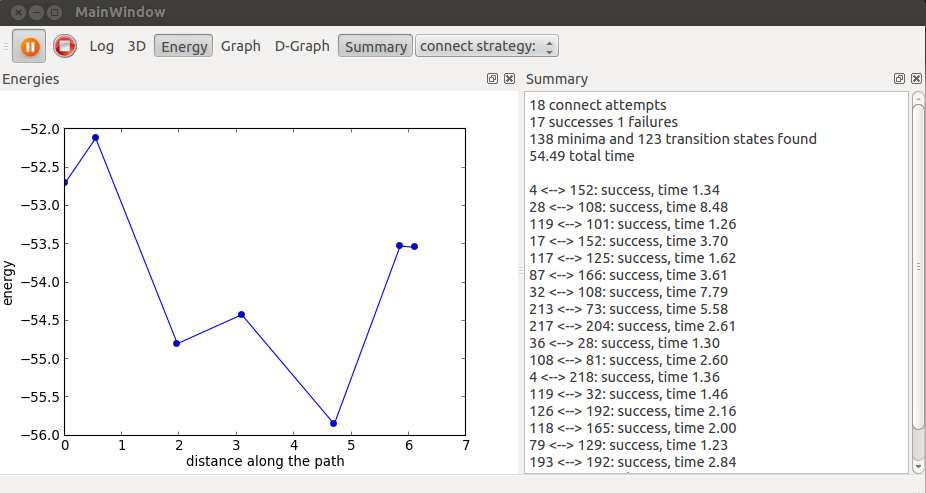
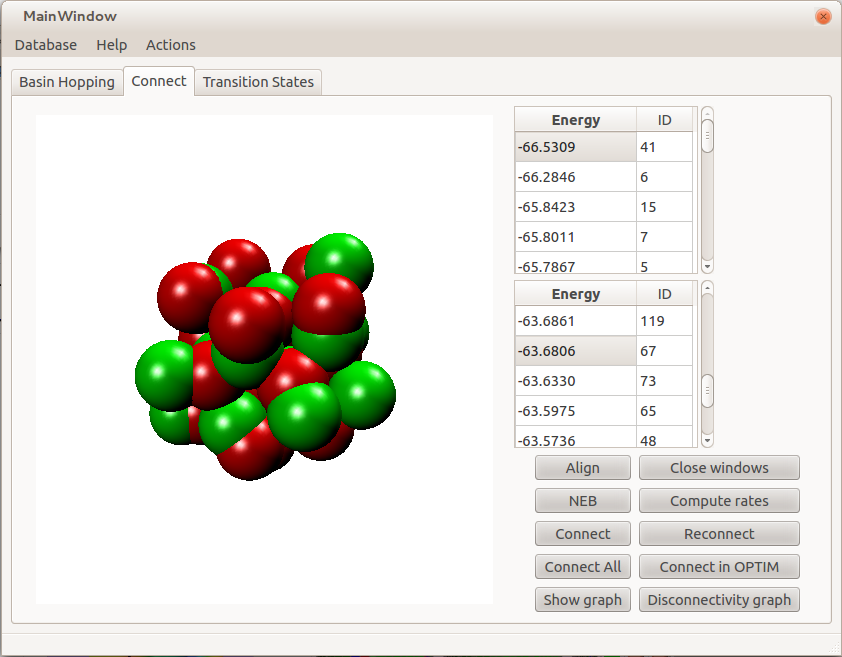
- Find transition states between minima using the double ended connect algorithm
- Compare the structures of minima.
- See a list of all known transition states, view the 3d structure, and look at the normal modes.
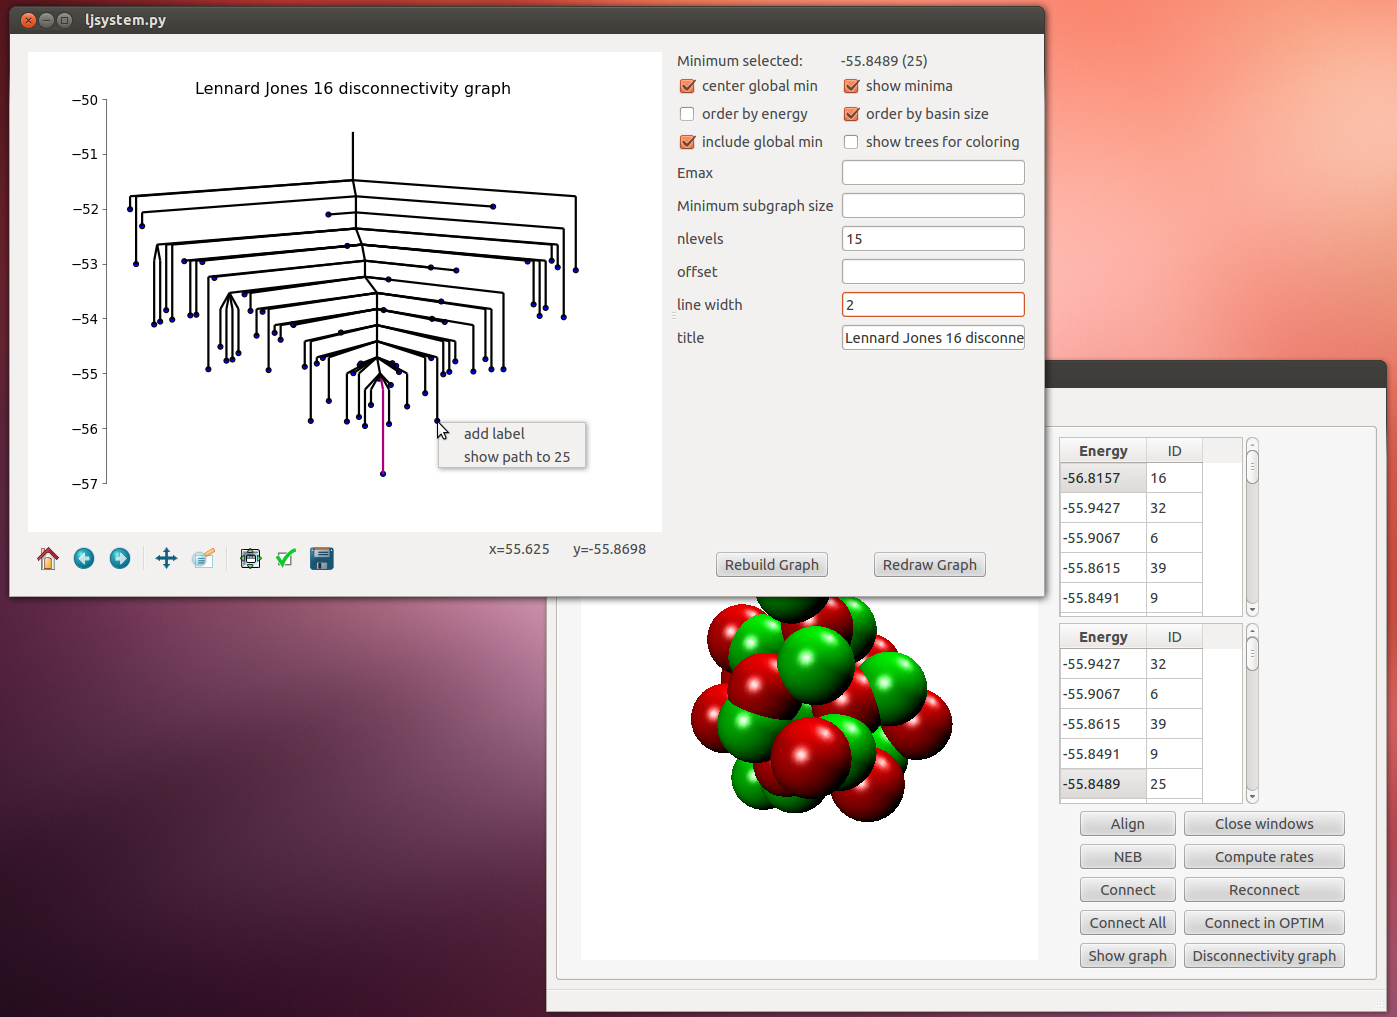
- Create an interactive disconnectivity graph. Clicking on a minimum in the disconnectivity graph will bring up the minimum in the main window for 3D viewing and analysis.
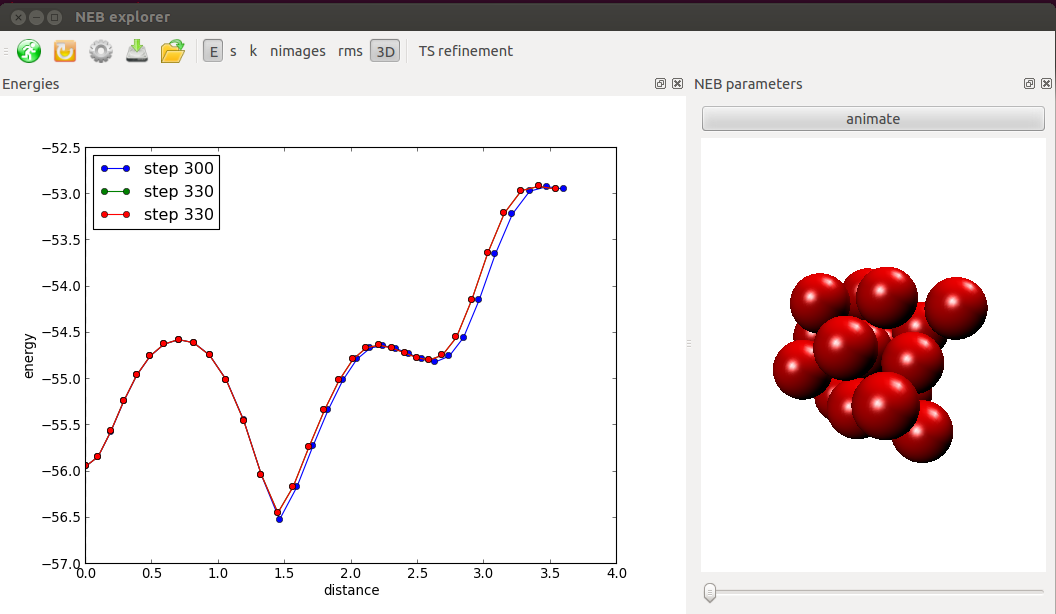
- Run the nudged elastic band algorithm interactively.
pele GUI (pele.gui)
This module contains all the necessary components for running the gui.
| run_gui(system[, db, application]) | The top level function that will launch the gui for a given system |
Simply initialize your system and pass it to run_gui:
from pele.systems import LJCluster
from pele.gui import run_gui
mysystem = LJCluster(13)
run_gui(mysystem)
if you pass a database file name it will connect to an existing database or create a new one at that location:
run_gui(mysystem, db="database.sqlite")
Preparing my System for use in the gui
If you have written your own system class and want to run it in the gui, there are a few additional member functions must be defined:
mysystem.draw(coords, index)
mysystem.smooth_path(images)
Both of these are used for displaying your system in a 3D OpenGL renderer. See BaseSystem and existing derived classes like LJCluster and BLJCluster for more information and examples of how to implement these.